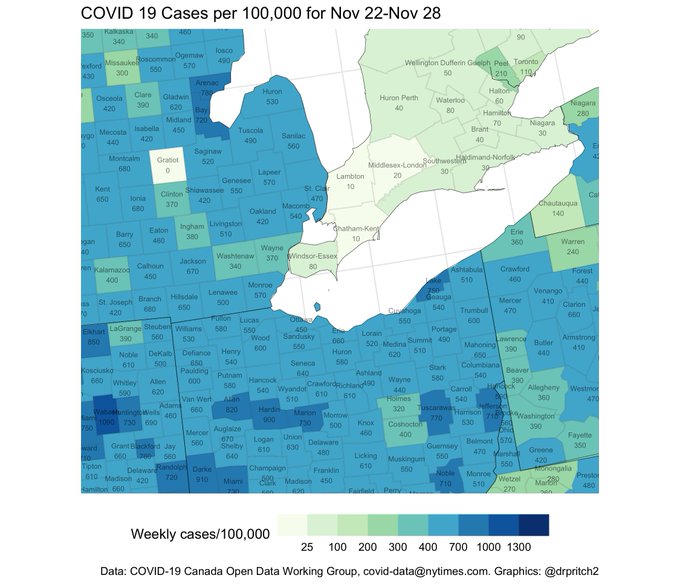
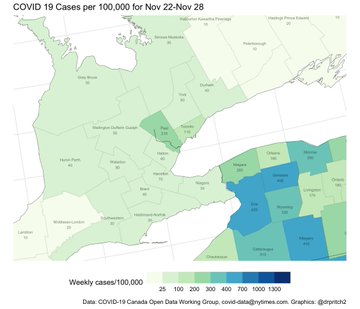
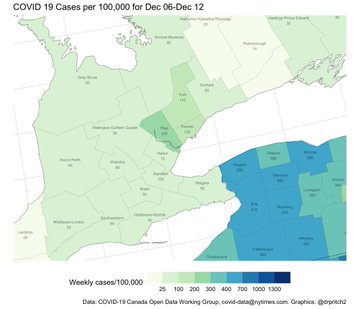
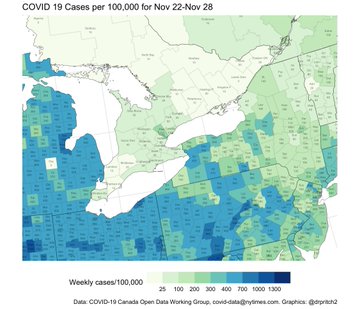
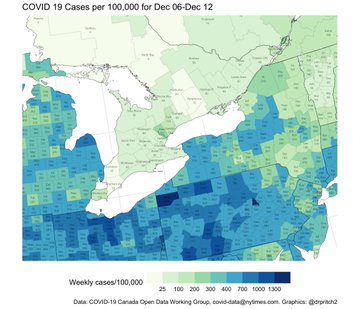
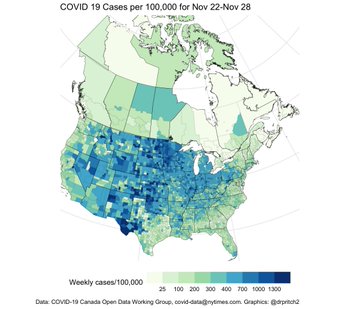
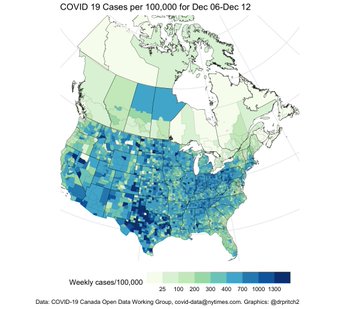
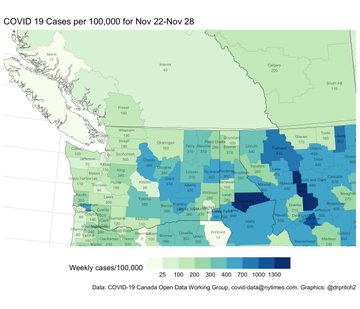
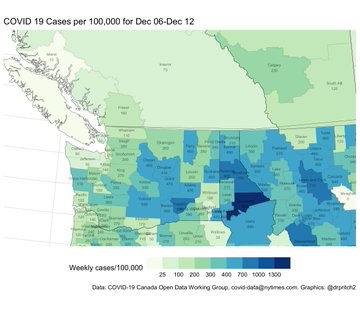
Data visualization shared by David Pritchard of Ottawa (Dec. 14, 2020) again helps us to better compare Covid infection rates in Canada, as compared to the United States

A Dec. 14, 2020 Atlantic article, which assists a person to contextualize the current post, is entitled: “How Science Beat the Virus. And what it lost in the process.”

An excerpt reads:

Amid a long winter of sickness, it’s hard not to focus on the political failures that led us to a third surge. But when people look back on this period, decades from now, they will also tell stories, both good and bad, about this extraordinary moment for science. At its best, science is a self-correcting march toward greater knowledge for the betterment of humanity. At its worst, it is a self-interested pursuit of greater prestige at the cost of truth and rigor. The pandemic brought both aspects to the fore. Humanity will benefit from the products of the COVID‑19 pivot. Science itself will too, if it learns from the experience.

A previous post is entitled:

Data visualization shared by David Pritchard of Ottawa helps us better understand what is going on with COVID-19 in Canada, as compared to the United States

What follows below – all of the images and text that you see – is from a hugely impressive and informative Dec. 14, 2020 Twitter thread by David Pritchard of Ottawa.

As with the thread that I posted earlier (see link above), this narrative underlines that data visualization can do a tremendously valuable job in telling us some of the things that we can learn from data.

Twitter thread from David Pritchard reads:

1/ Windsor: entered its grey #Covid19on lockdown today, closed its schools for the week. Across the border: while Michigan has eased up a little Ohio and Pennsylvania worsened significantly over the last two weeks. They’re no Dakotas, but Ohio is 4th worst in US this week.

Image

Image

2/ Greater Toronto region: Peel and Toronto finally stabilized, York joins the lockdown; Hamilton and Durham nearly there. Across the border: Buffalo (Erie) stable, but rising rates across nearby parts of New York. Rochester (Monroe) up 50% over last two weeks, almost 3x Peel.

Image

Image

3/ Southern Ontario: rural regions mostly all above 25 now. Across the border: you can really see the worsening condition in Ohio, Pennsylvania and New York in this map. The tide is rising right next door. The prairie provinces buckled under these conditions.

Image

Image

4/ The Prairies: the northern regions are now at US weekly rates of Covid. Alberta’s in worse shape overall, as its major cities are high. Across the border: COVID rates are receding, finally, after a severe wave through the Dakotas and Minnesota. ND: 1 of every 675 dead.

Image

Image

5/ North America: the USA’s post-Thanksgiving growth is now visible: the biggest growth has been in the northeast and southeast, though rural Texas and California jump out at the eye first. For Canadians, cross-border cases should remain a concern.

Image

Image

6/ In the news: this editorial hits the nail on the head.
Fahad Razak
@DrFahadRazak
Another phenomenal ⁦@globeandmail⁩ oped: “If you’ve ever wondered why a Toronto suburb of 1.5 million is one of the hardest hit spots in Canada’s COVID-19 pandemic, ask yourself this question: When was the last time you ordered something online?” theglobeandmail.com/opinion/editor
*
7/ I pointed this out before: 80% of the 5 million border crossings were exempted from quarantine. cbc.ca/news/business/ The CBC continued to report on exemptions yesterday:
Ottawa granted 1,700 special quarantine exemptions to sports leagues and business travellers | CBC…
A total of 1,790 people entering Canada during the COVID-19 pandemic have received special permission from Ottawa to skip quarantine because their trip was deemed in the national interest.
cbc.ca
8/ Bonus map: BC. Washington state’s as bad as it’s been. North of Seattle (Snohomish, Skagit_) and Okanagan counties are all up 50% since Thanksgiving. Northern Idaho is back to where it was in early November, and Montana’s only improving slowly.

Image

Image

9/ BC border: an older map (start of November) for comparison.

0 replies

Leave a Reply

Want to join the discussion?
Feel free to contribute!

Leave a Reply

Your email address will not be published. Required fields are marked *